Climate Debt worldwide
Fossil CO2 Emissions: European Union, United States and China (Per capita and Total)
/2025/ The graphs below show the Fossil CO2 Emissions in tons Per capita from EU-27 in comparison to the United States, China and global emissions. Chinese emissions Per capita exceeded the global average around 2004 and EU-27 around 2011.
Global Indicator Updates 2025: Global Temperature, CO2 content in the Atmosphere and Population
/2025/ The three Global Indicators included in the calculations of Climate Debt in ClimatePositions are: 1) Global Temperature, 2) CO2 content in the atmosphere, and 3) Global Population. In 25 years these three indicators have caused a decrease in the Fossil CO2 Emission Reduction Target from 1.00 ton to 0.55 ton – by 2059.

Climate Debt of China 2025: $2698 Billion or 29.1% of the Global Climate Debt (or $1915 Per Capita)
/2025/ China ranks 31st in Climate Debt Per Capita accumulated 2000-2025. Below are some key figures in the calculations. The diagram above shows the Fossil CO2 Emissions Per Capita and the Free Level of emissions (green). The wide straight red line shows emissions in the 1990s (baseline in the calculations).
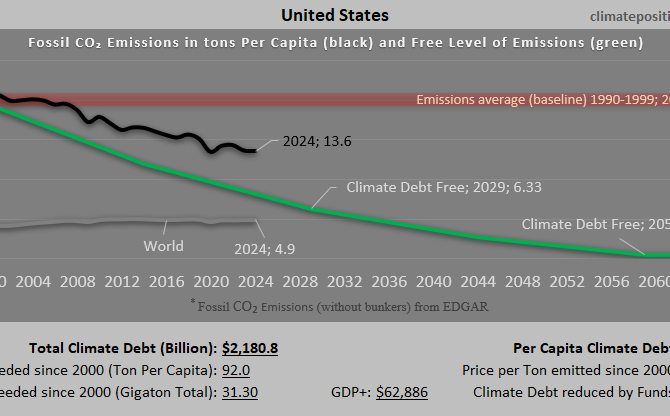
Climate Debt of United States 2025: $2181 Billion or 23.5% of the Global Climate Debt (or $6412 Per Capita)
/2025/ United States ranks 11th in Climate Debt Per Capita accumulated 2000-2025. Below are some key figures in the calculations. The diagram above shows the Fossil CO2 Emissions Per Capita and the Free Level of emissions (green). The wide straight red line shows emissions in the 1990s (baseline in the calculations).
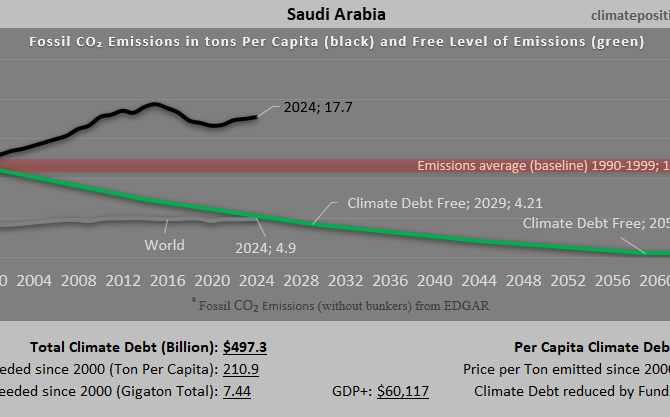
Climate Debt of Saudi Arabia 2025: $497 Billion or 5.4% of the Global Climate Debt (or $14087 Per Capita)
/2025/ Saudi Arabia ranks 4th in Climate Debt Per Capita accumulated 2000-2025. Below are some key figures in the calculations. The diagram above shows the Fossil CO2 Emissions Per Capita and the Free Level of emissions (green). The wide straight red line shows emissions in the 1990s (baseline in the calculations).
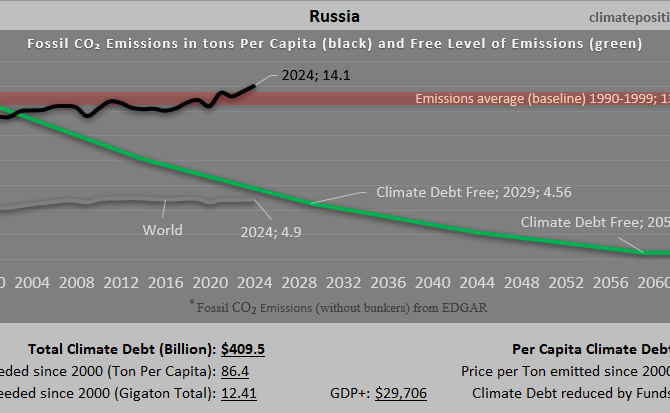
Climate Debt of Russia 2025: $409 Billion or 4.4% of the Global Climate Debt (or $2853 Per Capita)
/2025/ Russia ranks 23rd in Climate Debt Per Capita accumulated 2000-2025. Below are some key figures in the calculations. The diagram above shows the Fossil CO2 Emissions Per Capita and the Free Level of emissions (green). The wide straight red line shows emissions in the 1990s (baseline in the calculations).
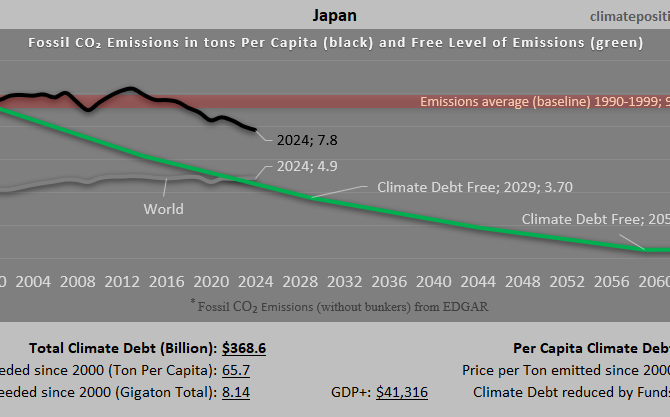
Climate Debt of Japan 2025: $369 Billion or 4.0% of the Global Climate Debt (or $2973 Per Capita)
/2025/ Japan ranks 21st in Climate Debt Per Capita accumulated 2000-2025. Below are some key figures in the calculations. The diagram above shows the Fossil CO2 Emissions Per Capita and the Free Level of emissions (green). The wide straight red line shows emissions in the 1990s (baseline in the calculations).
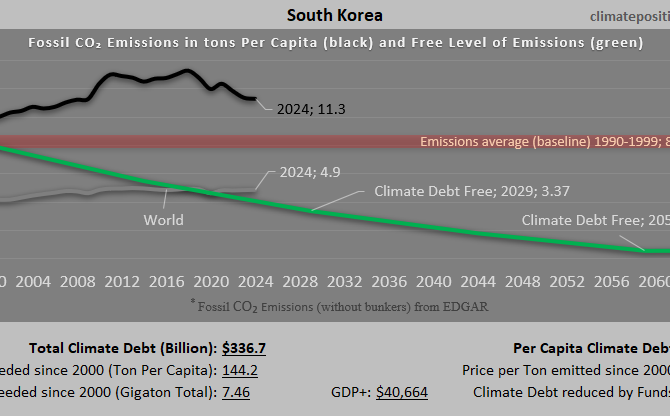
Climate Debt of South Korea 2025: $337 Billion or 3.6% of the Global Climate Debt (or $6507 Per Capita)
/2025/ South Korea ranks 10th in Climate Debt Per Capita accumulated 2000-2025. Below are some key figures in the calculations. The diagram above shows the Fossil CO2 Emissions Per Capita and the Free Level of emissions (green). The wide straight red line shows emissions in the 1990s (baseline in the calculations).

Climate Debt of Canada 2025: $311 Billion or 3.4% of the Global Climate Debt (or $7533 Per Capita)
/2025/ Canada ranks 9th in Climate Debt Per Capita accumulated 2000-2025. Below are some key figures in the calculations. The diagram above shows the Fossil CO2 Emissions Per Capita and the Free Level of emissions (green). The wide straight red line shows emissions in the 1990s (baseline in the calculations).

Climate Debt of Australia 2025: $233 Billion or 2.5% of the Global Climate Debt (or $8567 Per Capita)
/2025/ Australia ranks 8th in Climate Debt Per Capita accumulated 2000-2025. Below are some key figures in the calculations. The diagram above shows the Fossil CO2 Emissions Per Capita and the Free Level of emissions (green). The wide straight red line shows emissions in the 1990s (baseline in the calculations).
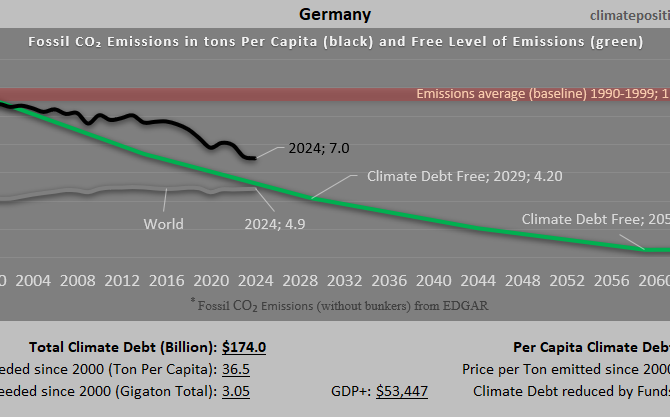
Climate Debt of Germany 2025: $174 Billion or 1.9% of the Global Climate Debt (or $2084 Per Capita)
/2025/ Germany ranks 29th in Climate Debt Per Capita accumulated 2000-2025. Below are some key figures in the calculations. The diagram above shows the Fossil CO2 Emissions Per Capita and the Free Level of emissions (green). The wide straight red line shows emissions in the 1990s (baseline in the calculations).
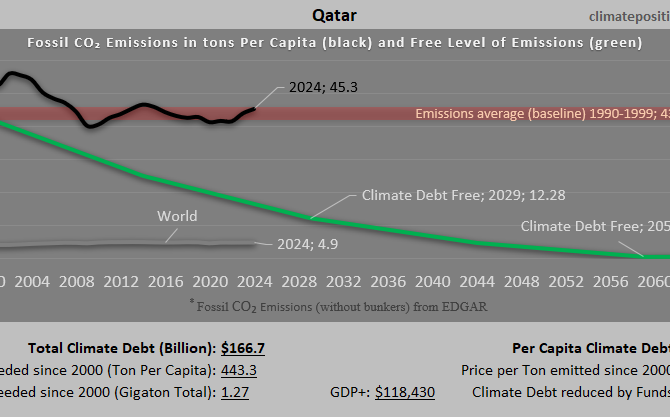
Climate Debt of Qatar 2025: $167 Billion or 1.8% of the Global Climate Debt (or $58332 Per Capita)
/2025/ Qatar ranks 1st in Climate Debt Per Capita accumulated 2000-2025. Below are some key figures in the calculations. The diagram above shows the Fossil CO2 Emissions Per Capita and the Free Level of emissions (green). The wide straight red line shows emissions in the 1990s (baseline in the calculations).
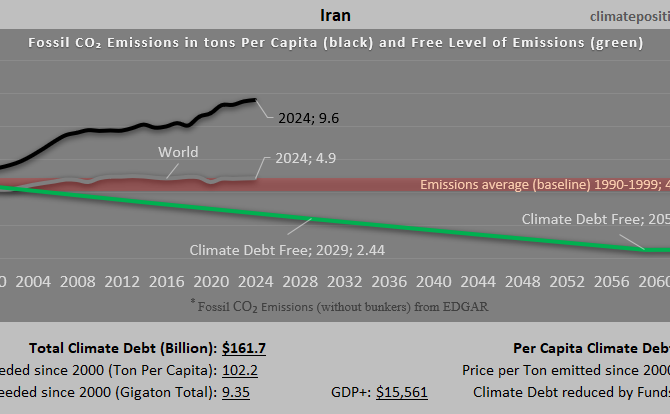
Climate Debt of Iran 2025: $162 Billion or 1.7% of the Global Climate Debt (or $1766 Per Capita)
/2025/ Iran ranks 35th in Climate Debt Per Capita accumulated 2000-2025. Below are some key figures in the calculations. The diagram above shows the Fossil CO2 Emissions Per Capita and the Free Level of emissions (green). The wide straight red line shows emissions in the 1990s (baseline in the calculations).
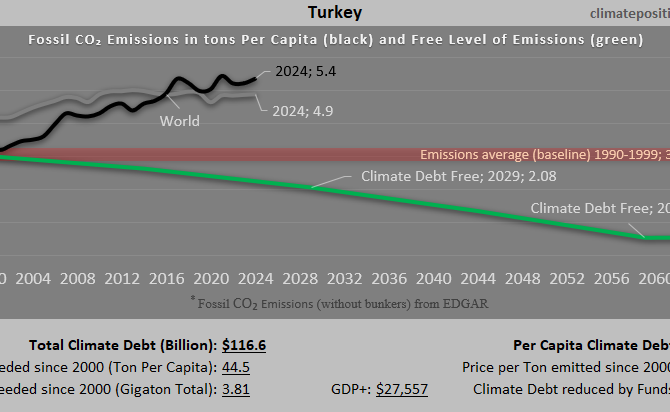
Climate Debt of Turkey 2025: $117 Billion or 1.3% of the Global Climate Debt (or $1364 Per Capita)
/2025/ Turkey ranks 42nd in Climate Debt Per Capita accumulated 2000-2025. Below are some key figures in the calculations. The diagram above shows the Fossil CO2 Emissions Per Capita and the Free Level of emissions (green). The wide straight red line shows emissions in the 1990s (baseline in the calculations).
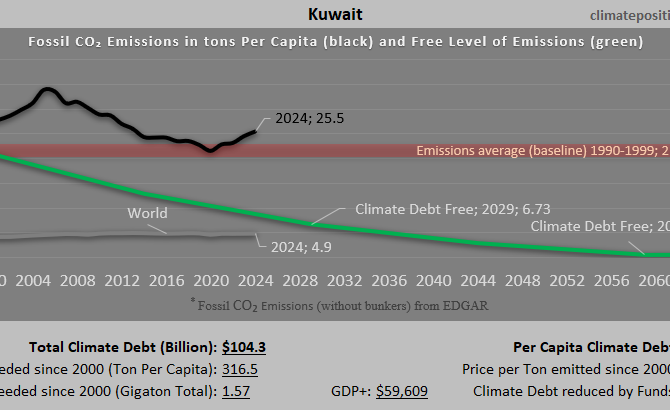
Climate Debt of Kuwait 2025: $104 Billion or 1.1% of the Global Climate Debt (or $20964 Per Capita)
/2025/ Kuwait ranks 2nd in Climate Debt Per Capita accumulated 2000-2025. Below are some key figures in the calculations. The diagram above shows the Fossil CO2 Emissions Per Capita and the Free Level of emissions (green). The wide straight red line shows emissions in the 1990s (baseline in the calculations).
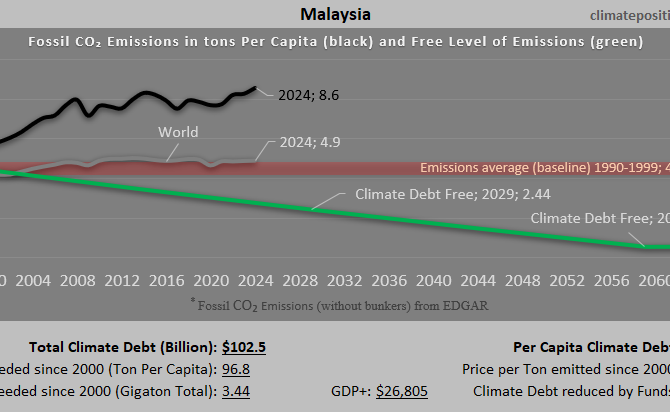
Climate Debt of Malaysia 2025: $102 Billion or 1.1% of the Global Climate Debt (or $2882 Per Capita)
/2025/ Malaysia ranks 22nd in Climate Debt Per Capita accumulated 2000-2025. Below are some key figures in the calculations. The diagram above shows the Fossil CO2 Emissions Per Capita and the Free Level of emissions (green). The wide straight red line shows emissions in the 1990s (baseline in the calculations).
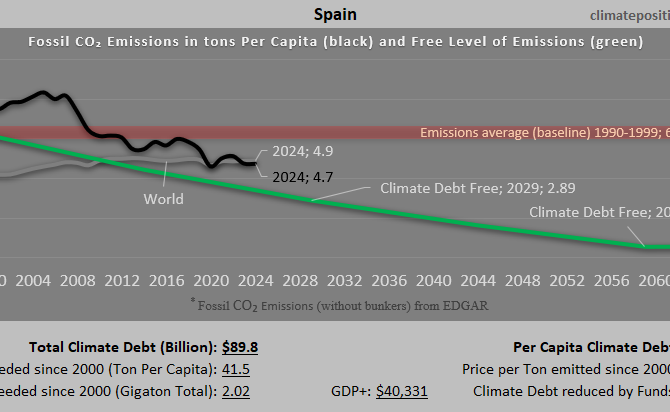
Climate Debt of Spain 2025: $90 Billion or 0.97% of the Global Climate Debt (or $1839 Per Capita)
/2025/ Spain ranks 34th in Climate Debt Per Capita accumulated 2000-2025. Below are some key figures in the calculations. The diagram above shows the Fossil CO2 Emissions Per Capita and the Free Level of emissions (green). The wide straight red line shows emissions in the 1990s (baseline in the calculations).
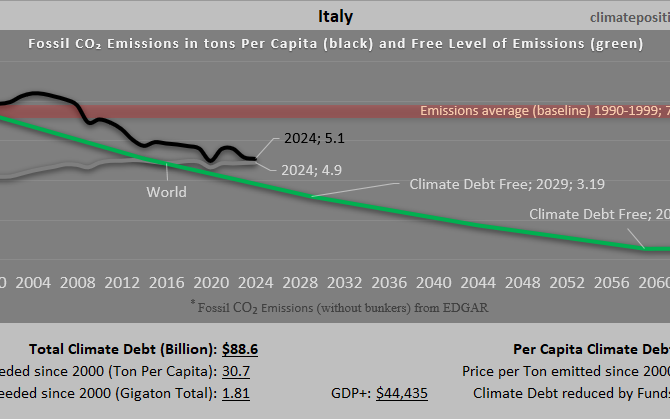
Climate Debt of Italy 2025: $89 Billion or 0.96% of the Global Climate Debt (or $1503 Per Capita)
/2025/ Italy ranks 39th in Climate Debt Per Capita accumulated 2000-2025. Below are some key figures in the calculations. The diagram above shows the Fossil CO2 Emissions Per Capita and the Free Level of emissions (green). The wide straight red line shows emissions in the 1990s (baseline in the calculations).

Climate Debt of India 2025: $66 Billion or 0.72% of the Global Climate Debt (or $46 Per Capita)
/2025/ India ranks 91st in Climate Debt Per Capita accumulated 2000-2025. Below are some key figures in the calculations. The diagram above shows the Fossil CO2 Emissions Per Capita and the Free Level of emissions (green). The wide straight red line shows emissions in the 1990s (baseline in the calculations).
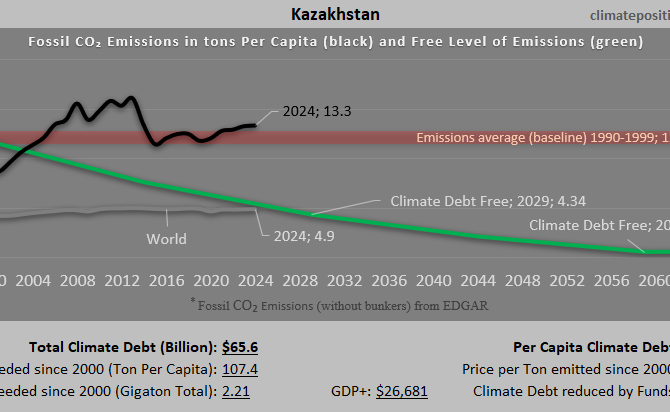
Climate Debt of Kazakhstan 2025: $66 Billion or 0.71% of the Global Climate Debt (or $3184 Per Capita)
/2025/ Kazakhstan ranks 20th in Climate Debt Per Capita accumulated 2000-2025. Below are some key figures in the calculations. The diagram above shows the Fossil CO2 Emissions Per Capita and the Free Level of emissions (green). The wide straight red line shows emissions in the 1990s (baseline in the calculations).
